

Decoding the BI and Analytics Landscape

We are aware of the universal adoption of Enterprise Resource Planning (ERP) and transaction processing systems. While Online Transaction Processing (OLTP) systems can provide good operational reporting capabilities, when it comes to complex analytical reports, the OLTP systems hit a performance snag.
Enter the Online Analytical Processing (OLAP) systems which reorganize select data into formats that lend themselves nicely to complex analysis. These OLAP systems, popularly referred to as BI systems have found widespread acceptance as they now provide a multidimensional view to data in your OLTP systems thereby providing multifaceted business insights and facilitating better decision making.
With the increase in its usage comes the need for representing the output provided by such systems in visually attractive graphical formats such as dashboards, drill-downs, etc. A host of presentation tools are now available in the market competing for businesses’ mind space. This has facilitated easier identification of issues and assisted in quicker decision making. It is now possible to represent sales data, cash flow data, among others, in the form of trends. Tools further can extend the trend and incorporate logic/algorithms to arrive at future estimates.
THE BI PANACEA
Based on such predicted trends, BI is expected to also be prescriptive and help take corrective action to stay on the course of realizing strategic objectives and goals. BI systems thus enable an analysis of past data for tracking the organization’s progress and ability to meet annual targets. It provides insight into customer behavior, can analyze purchase spend management, turn data into actionable information for improving process efficiencies, and more. BI / Analytical systems, thus, help improve decision making processes at all levels of management.
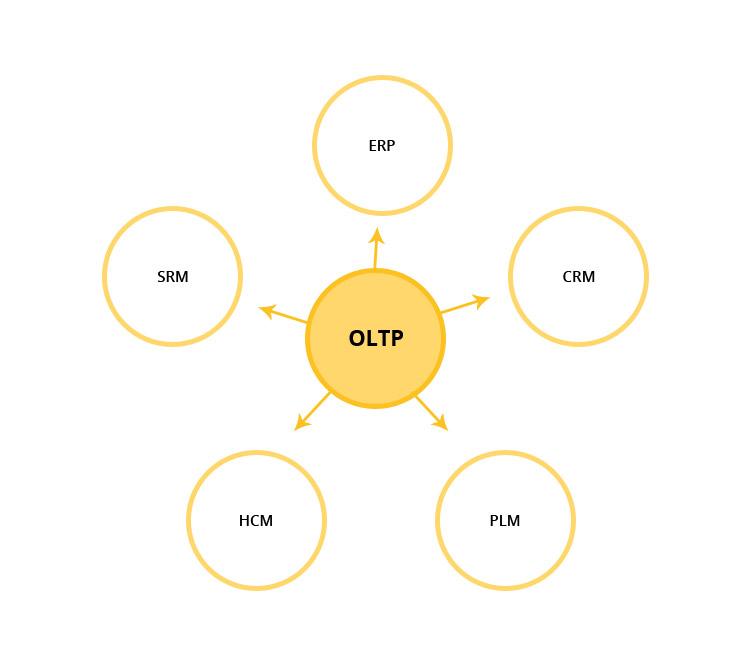
As can be understood from the preceding lines, a BI system comprises of three broad tools. The central tool is the data warehouse which receives select data from the multiple OLTP systems (ERP, CRM, SRM, HCM, PLM, custom-developed systems, etc.) and reorganizes it into data models that are conducive to reporting. Before that is the ETL (Extract, Transform, and Load) tool that extracts select data from the ERP systems and feeds it to the data warehouse. And finally, the presentation tools enable graphical/tabular representation of the data which is extracted from the data models in the data warehouse, based on user-specified parameters. Most ERP vendors offer these three tools. At the same time, it is possible to have presentation tools from multiple vendors reporting on the data models in a single data warehouse. Also, while using the ETL tool from the same vendor as the Data Warehouse vendor is preferable, it is not mandatory. One also has the option of custom building the data warehouse themselves.
As visibility into corporate data is possible, BI systems also lend themselves to better governance. Measures and metrics can be defined and set for specific processes and corresponding controls can be setup within the ERP system. BI systems can provide graphical representation of the process vis- à-vis such controls to enable effective process control, thereby avoiding possible risks arising from such exceeding such controls.
The explosive growth of data, Big Data, fuelled by social media and collaborative tools has presented an opportunity to analyse such data to improve product specifications, offer better services, reach prospect better and more. Big data needs to be analysed using techniques such as Natural Language Processing (NLP), summarized and fed into the data warehouse for analysing in individually or in conjunction with other corporate data. High performing In-memory devices are helping manage and analyse voluminous data for gains, while the In-memory computing devices help provide analytics in near real time. BI systems are now available in Software as a Service (SaaS) model thereby reducing the cost of ownership. Of late, vendors are combing the OLTP and OLAP solutions onto a single platform encouraged with the superior performance of the in-memory computing devices. With the promise of real-time analytics and prescriptive solutions, digital technology is driving faster realization of corporate goals.

BI systems are growing in their ability to provide complex analysis, by reporting on the data that exists within your systems as well as Big Data. It can provide information in visually attractive ways. It is moving from being informative to predictive to being prescriptive. But these advances also bring along with itself levels of complexity. This has led to CIOs exploring the option of outsourcing BI operations. The advent of cloud based BI systems have further supported this thought process. On the other hand, considerations of confidentiality are delaying such transitions.
Most Read
May 28, 2019
Driving Operational Excellence Through Design Thinking
February 11, 2020
The Art of Data Science
June 12, 2019
Financial Inclusion through Digital Diversification
